I wanted to brush up on my Python plotting skills in a fun way. Since I’ve been playing Pokemon Go recently, I decided to make a plot using data from the game. After a few iterations and even some OpenCV work, I decided that the following plot was the best solution.
Even though the above plot is probably the most useful, my favorite plot is the one where each bar is colored based on each Pokemon’s dominant colors. Analyzing each sprite and working with OpenCV was fun. I plan to delve further into k-means clustering and similar algorithms since they were really interesting.
Below is the Jupyter notebook I used to develop everything. If you want to play around with it locally, you can download it from my GitHub.
Plotting Pokemon Max Combat Power
This notebook contains nine different iterations of plots in an attempt to visualize a Pokemon’s max Combat Power (CP) in Pokemon GO. CP represents a Pokemon’s ability to perform well in battle, a higher CP generally means a Pokemon will be a better fighter. CP is calculated from a Pokemon’s base stats: Attack, Defence, and Stamina (somtimes called HP). As a Pokemon levels up, it’s base stats increase and as a result Combat Power also increases.
Table of Contents
- Equations – Calculating CP
- Mining Data
- Attempt 1 – Scatter Plot (Level vs CP)
- Attempt 2 – Scatter Plot (Pokemon vs CP)
- Attempt 3 – Layered Bar Chart
- Attempt 4 – Four Bar Chart Subplots (sliced by generation, sorted by number)
- Attempt 5 – Horizontal Bar Chart (sorted by number)
- Attempt 6 – Horizontal Bar Chart (sorted by CP)
- Attempt 7 – Horizonatal Bar Chart (Colorized)
- Attempt 8 – Four Bar Chart Subplots (sorted by CP)
- Attempt 9 – Four Horizontal Bar Chart Subplots (sorted by CP)
This project covered a huge variaty of programming and Python related topics that I had never been exposed to. I learned a lot of new information about the following (in no particular order):
Equations – Calculating CP 
The equations used to determine CP are based off of the stats of the Pokemon from the original game. Although the equations have changed over time, the following have been used since October 2018 (discovered by redditor u/Pikatrainer):
CP Formula
\begin{equation*} CP = BaseAttack \times \sqrt{BaseDef} \times \sqrt{BaseStam} \times \frac{CPMultiplier^2}{10} \end{equation*}Base Attack Formula
Higher and Lower are the Attack and Special Attack values from the original Pokemon games, whichever was higher or lower. \begin{equation*} BaseAttack = Round(ScaledAttack \times SpeedMod) \end{equation*}
\begin{equation*} ScaledAttack = Round(2 \times (\frac{7}{8}Higher + \frac{1}{8}Lower)) \end{equation*}Base Defense
\begin{equation*} BaseDefense = Round(ScaledDefense \times SpeedMod) \end{equation*}\begin{equation*} ScaledDefense = Round(2 \times (\frac{5}{8}Higher + \frac{3}{8}Lower)) \end{equation*}Base Stamina Formula
\begin{equation*} BaseStam = Floor(HP \times 1.75 + 50) \end{equation*}Speed Mod
\begin{equation*} SpeedMod = 1 + \frac{Speed – 75}{500} \end{equation*}Mining Data 
The PokemonGO app caches tons of data on a player’s phone to increase the performance. On Android, the cache is called GAME_MASTER and is stored in internal/emulated storage: Android/data/com.nianticlabs.pokemongo/files/remote_config_cache
The GAME_MASTER is in a Google Protocol Buffer format and must be parsed. There are projects like pogo-game-master-decoder on GitHub that can parse the GAME_MASTER.
Better yet, the GAME_MASTER files can be found in .json format in the pokmeongo-game-master GitHub project.
import matplotlib.pyplot as plt
import numpy as np
import pandas as pd
import json
import re
import urllib.request
import math

# If GAME_MASTER  exists, open it, otherwise download most recent GAME_MASTER from Github and save locally.
try:
    with open('GAME_MASTER.json') as json_file:
        data = json.load(json_file)
except FileNotFoundError:
    # Get the latest Pokemon GO GAME_MASTER in json format from GITHUB
    url = 'https://raw.githubusercontent.com/pokemongo-dev-contrib/pokemongo-game-master/master/versions/latest/GAME_MASTER.json'
    response = urllib.request.urlopen(url)
    raw_data = response.read()
    data = json.loads(raw_data)
    with open('GAME_MASTER.json', 'wb') as file:
        file.write(raw_data)


pattern_pokemon = re.compile('^V\d{4}_POKEMON_.*$') # Regex to match V####_POKEMON_

pokemon_stats = []
cp_multipliers = []

for template in data['itemTemplates']:
    if pattern_pokemon.match(template['templateId']):

        dictRow = {}

        # Pokemon Template ID
        dictRow['TemplateId'] = template['templateId']

        # Pokemon Number
        pokemon_number = re.findall("\d{4}", template['templateId'])
        pokemon_number = int(pokemon_number[0])
        dictRow['Number'] = pokemon_number

        # Pokemon Name
        name = template['pokemonSettings']['pokemonId']
        dictRow['Name'] = name

        # Pokemon Form
        form = template['pokemonSettings'].get('form', '')
        form = form.replace(name+'_', '').replace('_',' ') # remove name from form
        dictRow['Form'] = form

        # Stats
        dictRow['baseStamina'] = template['pokemonSettings']['stats']['baseStamina']
        dictRow['baseAttack'] = template['pokemonSettings']['stats']['baseAttack']
        dictRow['baseDefense'] = template['pokemonSettings']['stats']['baseDefense']

        # Flee and Capture rate
        dictRow['baseFleeRate'] = template['pokemonSettings']['encounter'].get('baseFleeRate', 0.0)
        dictRow['baseCaptureRate'] = template['pokemonSettings']['encounter'].get('baseCaptureRate', 0.0)


        #if form != 'NORMAL': # ignore NORMAL forms because they are duplicates
        pokemon_stats.append(dictRow)

    # CP Multiplier
    if template['templateId'] == 'PLAYER_LEVEL_SETTINGS':
        cp_multipliers = template['playerLevel']['cpMultiplier']


df = pd.DataFrame(pokemon_stats)
print(df.head())
print("Done processing.")
  Form        Name  Number                TemplateId  baseAttack  \
0        BULBASAUR       1   V0001_POKEMON_BULBASAUR         118
1          IVYSAUR       2     V0002_POKEMON_IVYSAUR         151
2         VENUSAUR       3    V0003_POKEMON_VENUSAUR         198
3       CHARMANDER       4  V0004_POKEMON_CHARMANDER         116
4       CHARMELEON       5  V0005_POKEMON_CHARMELEON         158

   baseCaptureRate  baseDefense  baseFleeRate  baseStamina
0             0.20          111          0.10          128
1             0.10          143          0.07          155
2             0.05          189          0.05          190
3             0.20           93          0.10          118
4             0.10          126          0.07          151
Done processing.
Processing Data – Applying Equations 
Now that we have our data parsed, we want to do some calculations on it. Below we apply the Combat Power equation mentioned above. We also determine which Generation each Pokemon belongs to; this will be helpful later.
def determine_generation (row):
    if row['Number'] <= 151:
        return 1
    if 151 < row['Number'] <= 251:
        return 2
    if 251 < row['Number'] <= 386:
        return 3
    if 386 < row['Number'] <= 493:
        return 4
    if 493 < row['Number'] <=649:
        return 5
    if 649 < row['Number'] <= 721:
        return 6
    if 721< row['Number'] <= 809:
        return 7
    if row['Number'] > 809:
        return 8


# Calculate Max CP for each Pokemon
sqrtDef = np.sqrt(df['baseDefense'] + 15) # +15 assumes perfect IV
sqrtStam = np.sqrt(df['baseStamina'] + 15)
cpMult20 = (cp_multipliers[19]**2) / 10
cpMult30 = (cp_multipliers[29]**2) / 10
cpMult40 = (cp_multipliers[39]**2) / 10

df['cp_level_20'] = np.floor((df['baseAttack'] + 15) * sqrtDef * sqrtStam * cpMult20)
df['cp_level_30'] = np.floor((df['baseAttack'] + 15)  * sqrtDef * sqrtStam * cpMult30)
df['cp_level_40'] = np.floor((df['baseAttack'] + 15)  * sqrtDef * sqrtStam * cpMult40)

# Cast CP columns to integers
df['cp_level_20'] = pd.to_numeric(df['cp_level_20'], downcast='integer')
df['cp_level_30'] = pd.to_numeric(df['cp_level_30'], downcast='integer')
df['cp_level_40'] = pd.to_numeric(df['cp_level_40'], downcast='integer')

# Determine generation for each Pokemon
df['Generation'] = df.apply(determine_generation, axis=1)

print(df.head())
print('Done processing data')
  Form        Name  Number                TemplateId  baseAttack  \
0        BULBASAUR       1   V0001_POKEMON_BULBASAUR         118
1          IVYSAUR       2     V0002_POKEMON_IVYSAUR         151
2         VENUSAUR       3    V0003_POKEMON_VENUSAUR         198
3       CHARMANDER       4  V0004_POKEMON_CHARMANDER         116
4       CHARMELEON       5  V0005_POKEMON_CHARMELEON         158

   baseCaptureRate  baseDefense  baseFleeRate  baseStamina  cp_level_20  \
0             0.20          111          0.10          128          637
1             0.10          143          0.07          155          970
2             0.05          189          0.05          190         1554
3             0.20           93          0.10          118          560
4             0.10          126          0.07          151          944

   cp_level_30  cp_level_40  Generation
0          955         1115           1
1         1456         1699           1
2         2332         2720           1
3          840          980           1
4         1417         1653           1
Done processing data
Attempt 1 – Scatter Plot (Level vs CP) 
This graph is bad because we cannot compare each pokemon in any way. The only insight we gain is that Pokemon tend to get stronger as they increase in level. In order to compare CP of each Pokemon, we need Pokemon on the x-axis (not CP).
import matplotlib.pyplot as plt
import numpy as np
import pandas as pd
import random

# Magic command to show plots in Jupyter
%matplotlib inline

# Plot each pokemon's CP with respect to Level
for row in df.itertuples():

    x = [20,30,40]
    y = [row.cp_level_20, row.cp_level_30, row.cp_level_40]

    rng = np.random.RandomState(random.randint(1,101)) # make random state different on each loop
    colors = rng.rand(3) # Generate list of 3 values [r,g,b]
    plt.scatter(x,y, c=colors, alpha=0.7)

plt.xlabel('Pokemon Level')
plt.ylabel('Combat Power (CP)')
plt.savefig('Pokemon_Max_CP_Attempt_1.png', format='png', dpi=1000) # Export Figure as high resolution

Attempt 2 – Scatter Plot (Pokemon vs CP) 
This attempt is better as we can now compare each Pokemon’s CP. Using a different color for each level allows us to compare the CP increase for each Pokemon as it levels up. Unfortunately, we cannot tell which datapoints match to which Pokemon. Also, the points are so clustered that it is difficult to tell which set of points coorespond to each Pokemon.
import matplotlib.pyplot as plt
import numpy as np
import pandas as pd
import string as s
%matplotlib inline


df = df.sort_values('Number')

plt.scatter(df.index.values, df['cp_level_20'], label='Lvl 20 Max CP', color='green',s=1)
plt.scatter(df.index.values, df['cp_level_30'], label='Lvl 30 Max CP', color='orange', s=1)
plt.scatter(df.index.values, df['cp_level_40'], label='Lvl 40 Max CP', color='red', s=1)

plt.legend()
plt.xlabel('Pokemon Id')
plt.ylabel('Combat Power (CP)')
plt.title('Pokemon Max CP at Level 20, 30, 40')
plt.savefig('Pokemon_Max_CP_Attempt_2.png', format='png', dpi=1000) # Export Figure as high resolution

Attempt 3 – Layered Bar Chart 
This attempt is much better. The CP values are stacked as bars on top of eachother instead as points like in Attempt 2. This makes it easier to keep track of which data cooresponds to each Pokemon. While we can now view ever Pokemon’s name at the bottom, there are so many that the x-axis labels become too small to read without high resolution images and zooming.
Plot Data
Layer bars on top of eachother by plotting sequentially. This works because we know that CP always increases with level increase. We could have also created three bars per Pokemon, but this approach is more compact.
%matplotlib inline
#%matplotlib notebook

# Layer bar charts
plt.bar(df.index.values, df['cp_level_40'], label='Lvl 40 Max CP', color='red', width=0.5)
plt.bar(df.index.values, df['cp_level_30'], label='Lvl 30 Max CP', color='orange', width=0.5)
plt.bar(df.index.values, df['cp_level_20'], label='Lvl 20 Max CP', color='green', width=0.5)

# Need to remove duplicates in NumId column by incrementing NumId when a special pokemon exists
plt.xticks(df.index.values, df['Name'], fontsize=1, rotation=90)
ax=plt.gca() # GetCurrentAxis of plot
ax.xaxis.set_tick_params(labelsize=1, width=0.1, pad=0.5)

plt.legend()
plt.grid(axis='y')
plt.xlabel('Pokemon Id')
plt.ylabel('Combat Power (CP)')
plt.title('Pokemon Max CP')

plt.savefig('Pokemon_Max_CP_Attempt_3.png', format='png', dpi=1000) # Export Figure as high resolution
plt.show()

Attempt 4 – Four Bar Chart Subplots (sliced by generation, sorted by number) 
Make one subplot for each generation of Pokemon so that we can read the x-axis labels.
%matplotlib inline
#%matplotlib notebook

plt.clf() # clear plot
#plt.cla() # clear axis

# Create figure to add subplots to
fig, ax = plt.subplots(nrows=4, sharey=True)
fig.set_size_inches(11, 8.5)

for i in range(0,4): # Iterate through each Pokemon generation

    gen = df.loc[df['Generation'] == (i+1)]

    # Layer bars on top of eachother as before
    ax[i].bar(gen.index.values, gen['cp_level_40'], label='Lvl 40 Max CP', color='red')
    ax[i].bar(gen.index.values, gen['cp_level_30'], label='Lvl 30 Max CP', color='orange')
    ax[i].bar(gen.index.values, gen['cp_level_20'], label='Lvl 20 Max CP', color='green')

    # Define x-axis
    ax[i].set_xticks(gen.index.values)
    ax[i].set_xticklabels(gen['Name'] + ' ' + gen['Form'],rotation=90, fontsize=5)
    ax[i].tick_params(axis='x', which='minor', bottom=False)

    # Define y-axis
    ax[i].set_yticks([1000,2000,3000,4000])
    ax[i].grid(axis='y')

    ax[i].set_yticks([500,1500,2500,3500,4500], minor=True)
    ax[i].grid(axis='y', which='minor', linestyle='--')


# Set Legend above first axes
#ax[0].legend(loc='upper center', bbox_to_anchor=(0., 1.1, 1., .102),fancybox=True, shadow=True, ncol=4)
handles, labels = ax[0].get_legend_handles_labels()
fig.legend(handles, labels, bbox_to_anchor=(0., 0.5, 1.2, .102), loc='center right', fancybox=True, shadow=True)

# Set X and Y labels on figure
#fig.suptitle('Pokemon Max CP by Level', y = 1.01, fontsize=18)
fig.suptitle('Pokemon Max CP by Level', y=1.015, fontsize=20)
fig.text(-.01, 0.5, 'Combat Power (CP)', ha='center', va='center', rotation='vertical')
fig.text(0.5, 0.04, 'Pokemon Id', ha='center', va='center')

fig.tight_layout() # Stop x-axis tick labels from being cropped

# Export Figure as high resolution
fig.savefig('Pokemon_Max_CP_Attempt_4.png', format='png', dpi=350, bbox_inches='tight') # tight required to prevent cropping
<Figure size 432x288 with 0 Axes>

Attempt 5 – Horizontal Bar Chart (sorted by number) 
In order to make the Pokemon names more readable, we can plot them on a horizontal bar chart.
%matplotlib inline

plt.clf() # clear plot
fig, ax = plt.subplots()
fig.set_size_inches(2, 20)

# Layer bar charts
ax.barh(df.index.values, df['cp_level_40'], label='Lvl 40 Max CP', color='red')
ax.barh(df.index.values, df['cp_level_30'], label='Lvl 30 Max CP', color='orange')
ax.barh(df.index.values, df['cp_level_20'], label='Lvl 20 Max CP', color='green')

plt.yticks(df.index.values, df['Name'] + ' ' + df['Form'], fontsize=1)
ax.yaxis.set_tick_params(labelsize=1, width=0.1, pad=0.5)
#ax.invert_yaxis()

# Define x-axis
ax.set_xticks([1000,2000,3000,4000])
ax.tick_params(axis='x', labelsize = 5)
ax.grid(axis='x')

ax.set_xticks([500,1500,2500,3500,4500], minor=True)
ax.grid(axis='x', which='minor', linestyle='--')

plt.legend(prop={'size': 5})
plt.xlabel('Combat Power (CP)')
plt.ylabel('Pokemon Id')
plt.title('Pokemon Max CP')
plt.savefig('Pokemon_Max_CP_Attempt_5.png', format='png', dpi=1000) # Export Figure as high resolution
<Figure size 432x288 with 0 Axes>

Attempt 6 – Horizontal Bar Chart (sorted by CP) 
Sort the data by Max CP to find the best Pokemon.
%matplotlib inline

# Sort Data
df = df.sort_values('cp_level_40')
df = df.reset_index(drop=True) # Set index to this newly sorted order

# Plot Data
plt.clf() # clear plot
fig, ax = plt.subplots()
fig.set_size_inches(2, 20)

# Layer bar charts
ax.barh(df.index.values, df['cp_level_40'], label='Lvl 40 Max CP', color='red')
ax.barh(df.index.values, df['cp_level_30'], label='Lvl 30 Max CP', color='orange')
ax.barh(df.index.values, df['cp_level_20'], label='Lvl 20 Max CP', color='green')

plt.yticks(df.index.values, df['Name'] + ' ' + df['Form'], fontsize=1)
ax.yaxis.set_tick_params(labelsize=1, width=0.1, pad=0.2)
#ax.invert_yaxis()

# Define x-axis
ax.set_xticks([1000,2000,3000,4000])
ax.tick_params(axis='x', labelsize = 5)
ax.grid(axis='x', alpha=0.7)

ax.set_xticks([500,1500,2500,3500,4500], minor=True)
ax.grid(axis='x', which='minor', linestyle='--', alpha=0.5)

ax.legend(prop={'size': 5})
plt.xlabel('Combat Power (CP)')
plt.ylabel('Pokemon Id')
plt.title('Pokemon Max CP')
plt.savefig('Pokemon_Max_CP_Attempt_6.png', format='png', dpi=1000) # Export Figure as high resolution
<Figure size 432x288 with 0 Axes>

Attempt 7 – Horizontal Bar Chart (Colorized) 
It may be beneficial to change the color of each bar so that they can be distinguished from neighboring bars. I also want there to be a coorelation between the bar color and the actual Pokemon. Since each Pokemon has a fairly unique color scheme, we can try to extract their colors to use in our next bar chart.
What color is Bulbasaur? – Getting to know OpenCV color spaces 
Below we read in an image file (PNG sprite of Bulbasaur) using OpenCV and take a look at how OpenCV stores each pixel in a Numpy matrix. We then view the image in the default BGR (Blue, Green, Red) colorspace and then convert it to the correct RGB (Red, Green, Blue) colorspace. Finally we create 3D plots of the image in both the RGB and HSV (Hue, Saturation, Value) color models.
This tutorial about OpenCV color spaces was helpful.
#%matplotlib notebook
%matplotlib inline

import cv2
import matplotlib.pyplot as plt
import numpy as np
from mpl_toolkits.mplot3d import Axes3D
from matplotlib import cm
from matplotlib import colors


bulba = cv2.imread('sprites/1.png') # reads image into numpy matrix in BGR color format
plt.imshow(bulba)
plt.show()
print('Bulbasaur looks sick. He is displayed in the BGR colorspace so Red and Blue are swapped. His red eyes are now blue.')

# Acess a pixel's BGR value
print("Pixel at Row 45 x Column 50: ",
      "[Blue: ", bulba[45,50,0],
      " Green: ", bulba[45,50,1],
     " Red: ", bulba[45,50,2], "]",
      sep='')

# Convert from BGR to RGB color format
bulba = cv2.cvtColor(bulba, cv2.COLOR_BGR2RGB)
plt.imshow(bulba)
plt.show()
print('Bulbasaur looks healthy now. He is now in RGB colorspace, so his eyes are now properly red.')


# Access a pixel's RGB values
print("Pixel at Row 45 x Column 50: ",
      "[Red: ", bulba[45,50,0],
      " Green: ", bulba[45,50,1],
     " Blue: ", bulba[45,50,2], "]",
      sep='')

r, g, b = cv2.split(bulba)
fig = plt.figure()
axis = fig.add_subplot(1, 1, 1, projection="3d")

# Normalize color ranges from 0-255 to 0-1
pixel_colors = bulba.reshape((np.shape(bulba)[0]*np.shape(bulba)[1], 3))
norm = colors.Normalize(vmin=0,vmax=255)
pixel_colors = norm(pixel_colors).tolist()

axis.scatter(r.flatten(), g.flatten(), b.flatten(), facecolors=pixel_colors, marker=".")
axis.set_xlabel("Red")
axis.set_ylabel("Green")
axis.set_zlabel("Blue")
plt.show()

# 3D Plot HSV (Hue, Saturation, Value)
hsv_bulba = cv2.cvtColor(bulba, cv2.COLOR_RGB2HSV)
h, s, v = cv2.split(bulba)
fig2 = plt.figure()
axis2 = fig2.add_subplot(1, 1, 1, projection="3d")
pixel_hsv = hsv_bulba.reshape((np.shape(hsv_bulba)[0]*np.shape(hsv_bulba)[1], 3))
norm.autoscale(pixel_hsv)
pixel_hsv = norm(pixel_hsv).tolist()
axis2.scatter(h.flatten(), s.flatten(), v.flatten(), facecolors=pixel_hsv, marker=".")
axis2.set_xlabel("Hue")
axis2.set_ylabel("Saturation")
axis2.set_zlabel("Value")

plt.show()

Bulbasaur looks sick. He is displayed in the BGR colorspace so Red and Blue are swapped. His red eyes are now blue.
Pixel at Row 45 x Column 50: [Blue: 148 Green: 148 Red: 57]

Bulbasaur looks healthy now. He is now in RGB colorspace, so his eyes are now properly red.
Pixel at Row 45 x Column 50: [Red: 57 Green: 148 Blue: 148]


Finding dominant colors in pokemon sprites (k-means and frequency count) 
Use OpenCV to find dominant color in sprite.
Tutorials used for k-means colors clustering: https://www.pyimagesearch.com/2014/05/26/opencv-python-k-means-color-clustering/
Sprites for each Pokemon are downloaded from https://veekun.com/dex/downloads.
Official sprites were missing from the set above for Meltan and Melmetal, but fan sprites were available on DeviantArt:
#%matplotlib notebook
%matplotlib inline

# import the necessary packages
from sklearn.cluster import KMeans
import matplotlib.pyplot as plt
import argparse
import cv2
import numpy as np
from matplotlib import colors


def centroid_histogram(clt):
    # grab the number of different clusters and create a histogram
    # based on the number of pixels assigned to each cluster
    numLabels = np.arange(0, len(np.unique(clt.labels_)) + 1)
    (hist, _) = np.histogram(clt.labels_, bins = numLabels)

    # normalize the histogram, such that it sums to one
    hist = hist.astype("float")
    hist /= hist.sum()

    # return the histogram
    hist = np.sort(hist)
    hist = hist[::-1]
    return hist


def plot_colors(hist, centroids):
    # initialize the bar chart representing the relative frequency
    # of each of the colors
    bar = np.zeros((50, 300, 3), dtype = "uint8")
    startX = 0

    # loop over the percentage of each cluster and the color of
    # each cluster
    for (percent, color) in zip(hist, centroids):
        # plot the relative percentage of each cluster
        endX = startX + (percent * 300)
        cv2.rectangle(bar, (int(startX), 0), (int(endX), 50),
        color.astype("uint8").tolist(), -1)
        startX = endX

    # return the bar chart
    return bar

def crop_image(img,tol=0):
    # img is image data
    # tol  is tolerance
    mask = img>tol
    return img[np.ix_(mask.any(1),mask.any(0))]


def kmeans_colors(image, clusters, plot=True):
    '''
    Function to get the dominant colors of an image based on Kmeans Algorithm

    Parameters:
        image: OpenCV (cv2) Image object in RGB colorspace.
        clusters: Number of clusters (how many colors return)
        plot: Toggle on or off to plot resulting colors

    Returns: KMeans object with attibutes:
        cluster_centers_: A list of RGB colors rounded to nearest int
        labels_: A list of pixels and their cooresponding color index in clusters list.
    '''

    # reshape the image to be a list of pixels
    image = image.reshape((image.shape[0] * image.shape[1], 3))

    # crop image with bounding box (effectively removes surrounding black pixels)
    image = crop_image(image)

    # cluster the pixel intensities
    clt = KMeans(n_clusters = clusters)
    clt.fit(image)
    roundClusters = np.around(clt.cluster_centers_).astype(int) # Round and convert RGB values to int
    clt.cluster_centers_ = roundClusters


    if plot is True:
        # Build a histogram of clusters and then create a figure
        # representing the number of pixels labeled to each color.
        hist = centroid_histogram(clt)
        bar = plot_colors(hist, clt.cluster_centers_)

        # show our kmeans bar
        plt.figure()
        plt.title('Kmeans dominant colors')
        plt.axis("off")
        plt.imshow(bar)

    return clt


def count_colors(image, remove_black=False, plot=True):
    # Convert image matrix to rgb array
    rgbArray = image.reshape((image.shape[0] * image.shape[1], 3))

    if remove_black:
        # select all rows that are not entirely zero
        rgbArray=rgbArray[np.all(rgbArray != 0, axis=1)]

    rgbArray, counts = np.unique(rgbArray, return_counts=True, axis=0)
    #print('colors: \n', colors)
    #print('count: \n', counts)

    # sort colors by their frequency, highest to lowest
    count_sort_indexes = np.argsort(-counts) # - means to sort highest to lowest

    rgbArray = rgbArray[count_sort_indexes]
    counts = counts[count_sort_indexes]

    # must normalize colors between 0 and 1 so that we can use set_color
    norm = colors.Normalize(vmin=0,vmax=255)
    rgbNorm = norm(rgbArray).tolist()

    if plot is True:
        num_bins = len(rgbArray)
        index = list(range(0, num_bins))

        plt.figure()
        barchart = plt.bar(index, counts)
        ax0 = plt.gca()
        ax0.xaxis.set_visible(False)
        ax0.set_ylabel('Pixel count')

        for j in range(num_bins): # iterate through bars and change each color
            barchart[j].set_color(rgbNorm[j])

        plt.show()

    return [rgbArray,rgbNorm, counts]


df = df.sort_values('Number')
df = df.reset_index(drop=True) # Set index to this newly sorted order
df['dominant_color_1'] = ''
df['dominant_color_2'] = ''
df['dominant_color_3'] = ''

for i in range(0,len(df)): # Process all Pokemon
    #print('Pokemon Name: ', str(df.iloc[i,df.columns.get_loc('Pokemon')]))
    #print('Pokemon Id: ', str(df.iloc[i,df.columns.get_loc('NumId')]))

    # Load the image and convert it from BGR to RGB so that
    # we can dispaly it properly with matplotlib.
    filepath = 'sprites/' + str(df.iloc[i,df.columns.get_loc('Number')]) + '.png' # filepath to image
    image = cv2.imread(filepath, cv2.IMREAD_COLOR)
    image = cv2.cvtColor(image, cv2.COLOR_BGR2RGB)

    # Show our image
    #plt.figure()
    #plt.axis("off")
    #plt.imshow(image)
    #plt.show()

    # Get dominant colors with k-means algorithm and plot.
    kmeans_colors(image, 3, plot=False)

    # Get dominant colors by counting frequency of each color
    rgbArray, rgbNormalized, counts = count_colors(image, remove_black=True, plot=False)

    # save top 3 dominant colors as hex values
    df.at[i, 'dominant_color_1'] = colors.to_hex(rgbNormalized[0])
    df.at[i, 'dominant_color_2'] = colors.to_hex(rgbNormalized[1])
    df.at[i, 'dominant_color_3'] = colors.to_hex(rgbNormalized[2])

print(df.head())
print('Done Processing')
  Form        Name  Number                TemplateId  baseAttack  \
0        BULBASAUR       1   V0001_POKEMON_BULBASAUR         118
1          IVYSAUR       2     V0002_POKEMON_IVYSAUR         151
2         VENUSAUR       3    V0003_POKEMON_VENUSAUR         198
3       CHARMANDER       4  V0004_POKEMON_CHARMANDER         116
4       CHARMELEON       5  V0005_POKEMON_CHARMELEON         158

   baseCaptureRate  baseDefense  baseFleeRate  baseStamina  cp_level_20  \
0             0.20          111          0.10          128          637
1             0.10          143          0.07          155          970
2             0.05          189          0.05          190         1554
3             0.20           93          0.10          118          560
4             0.10          126          0.07          151          944

   cp_level_30  cp_level_40  Generation dominant_color_1 dominant_color_2  \
0          955         1115           1          #399494          #62d5b4
1         1456         1699           1          #209483          #5acdbd
2         2332         2720           1          #20b49c          #105241
3          840          980           1          #ff9441          #de5239
4         1417         1653           1          #cd3939          #ff524a

  dominant_color_3
0          #101010
1          #317b52
2          #ff7b73
3          #101010
4          #101010
Done Processing
Plotting Attempt 7 – Horizonatal Bar Chart (Colorized) 
We can now see which pokemon are the best, however it is difficult to discern which bar cooresponds to what pokemon. Attempt 7 will assign the pokemon’s dominant colors to the color of the bar. A good example of this can be seen on http://pokepalettes.com/ (source code).
import matplotlib.pyplot as plt

%matplotlib inline

plt.clf() # clear plot
fig, ax = plt.subplots()
fig.set_size_inches(2, 20)

# Sort by highest cp first
df = df.sort_values('cp_level_40')
df = df.reset_index(drop=True) # Set index to this newly sorted order

# Layer bar charts
norm = colors.Normalize(vmin = 0, vmax=255) # normalize colors from 0-255 to 0.0 to 1.0
plt40 = ax.barh(df.index.values, df['cp_level_40'], label='Lvl 40 Max CP', color=df['dominant_color_3'])
plt30 = ax.barh(df.index.values, df['cp_level_30'], label='Lvl 30 Max CP', color=df['dominant_color_2'])
plt20 = ax.barh(df.index.values, df['cp_level_20'], label='Lvl 20 Max CP', color=df['dominant_color_1'])


plt.yticks(df.index.values, df['Name'] + ' ' + df['Form'], fontsize=1)
ax.yaxis.set_tick_params(labelsize=1, width=0.1, pad=0.2)

# Define x-axis
ax.set_xticks([1000,2000,3000,4000])
ax.tick_params(axis='x', labelsize = 5)
ax.grid(axis='x', alpha=0.7)

ax.set_xticks([500,1500,2500,3500,4500], minor=True)
ax.grid(axis='x', which='minor', linestyle='--', alpha=0.5)

# ax.legend(prop={'size': 5})
plt.xlabel('Combat Power (CP)')
plt.ylabel('Pokemon Id')
plt.title('Pokemon Max CP')
plt.savefig('Pokemon_Max_CP_Attempt_7.png', format='png', dpi=1000) # Export Figure as high resolution
<Figure size 432x288 with 0 Axes>

Attempt 8 – Four Bar Chart Subplots (sorted by CP) 
Okay so the colors from Attempt 7 are pretty, but a little bit overwelming for the eyes. Also, Attempt 7 does not really fit in a reasonable area. In this Attempt 8, we sort Pokemon by CP and make four subplots so that we can fiew all in a reasonable amount of space.
import math

%matplotlib inline
#%matplotlib notebook


# Get ranges of CP depending on iteration of loop
def get_range(i):
    return {
    0: df[df['cp_level_40'].between(0,999, inclusive = True)],
    1: df[df['cp_level_40'].between(1000,1999, inclusive = True)],
    2: df[df['cp_level_40'].between(2000,2999, inclusive = True)],
    3: df[df['cp_level_40'].between(3000,9999, inclusive = True)]
    }[i]


plt.clf() # clear plot
#plt.cla() # clear axis

# Create figure to add subplots to
fig, ax = plt.subplots(nrows=4, sharey=True)
fig.set_size_inches(11, 8.5)

# Sort by highest cp first
df = df.sort_values(['cp_level_40', 'Name'])
df = df.reset_index(drop=True) # Set index to this newly sorted order

for i in range(0,4): # make 4 subplots, increasing in CP on each

    # Divide data by 4 equal slices
    start = int(math.ceil(0 + (df.shape[0]/4) * i))
    stop = int(math.ceil((df.shape[0]/4) + (df.shape[0]/4) * i))

    gen = df[start:stop]

    # Layer bars on top of eachother as before
    ax[i].bar(gen.index.values, gen['cp_level_40'], label='Lvl 40 Max CP', color='red')
    ax[i].bar(gen.index.values, gen['cp_level_30'], label='Lvl 30 Max CP', color='orange')
    ax[i].bar(gen.index.values, gen['cp_level_20'], label='Lvl 20 Max CP', color='green')

    # Define x-axis
    ax[i].set_xticks(gen.index.values)
    ax[i].set_xticklabels(gen['Name'] + ' ' + gen['Form'],rotation=90, fontsize=5)
    ax[i].tick_params(axis='x', which='minor', bottom=False)

    # Define y-axis
    ax[i].set_yticks([1000,2000,3000,4000])
    ax[i].grid(axis='y')

    ax[i].set_yticks([500,1500,2500,3500,4500], minor=True)
    ax[i].grid(axis='y', which='minor', linestyle='--')


# Set Legend above first axes
#ax[0].legend(loc='upper center', bbox_to_anchor=(0., 1.1, 1., .102),fancybox=True, shadow=True, ncol=4)
handles, labels = ax[0].get_legend_handles_labels()
fig.legend(handles, labels, bbox_to_anchor=(0., 0.5, 1.2, .102), loc='center right', fancybox=True, shadow=True)

# Set X and Y labels on figure
#fig.suptitle('Pokemon Max CP by Level', y = 1.01, fontsize=18)
fig.suptitle('Pokemon Max CP by Level', y=1.015, fontsize=20)
fig.text(-.01, 0.5, 'Combat Power (CP)', ha='center', va='center', rotation='vertical')
fig.text(0.5, 0.04, 'Pokemon Id', ha='center', va='center')

fig.tight_layout() # Stop x-axis tick labels from being cropped

# Export Figure as high resolution
fig.savefig('Pokemon_Max_CP_Attempt_8.png', format='png', dpi=350, bbox_inches='tight') # tight required to prevent cropping

print("Done plotting")
Done plotting
<Figure size 432x288 with 0 Axes>

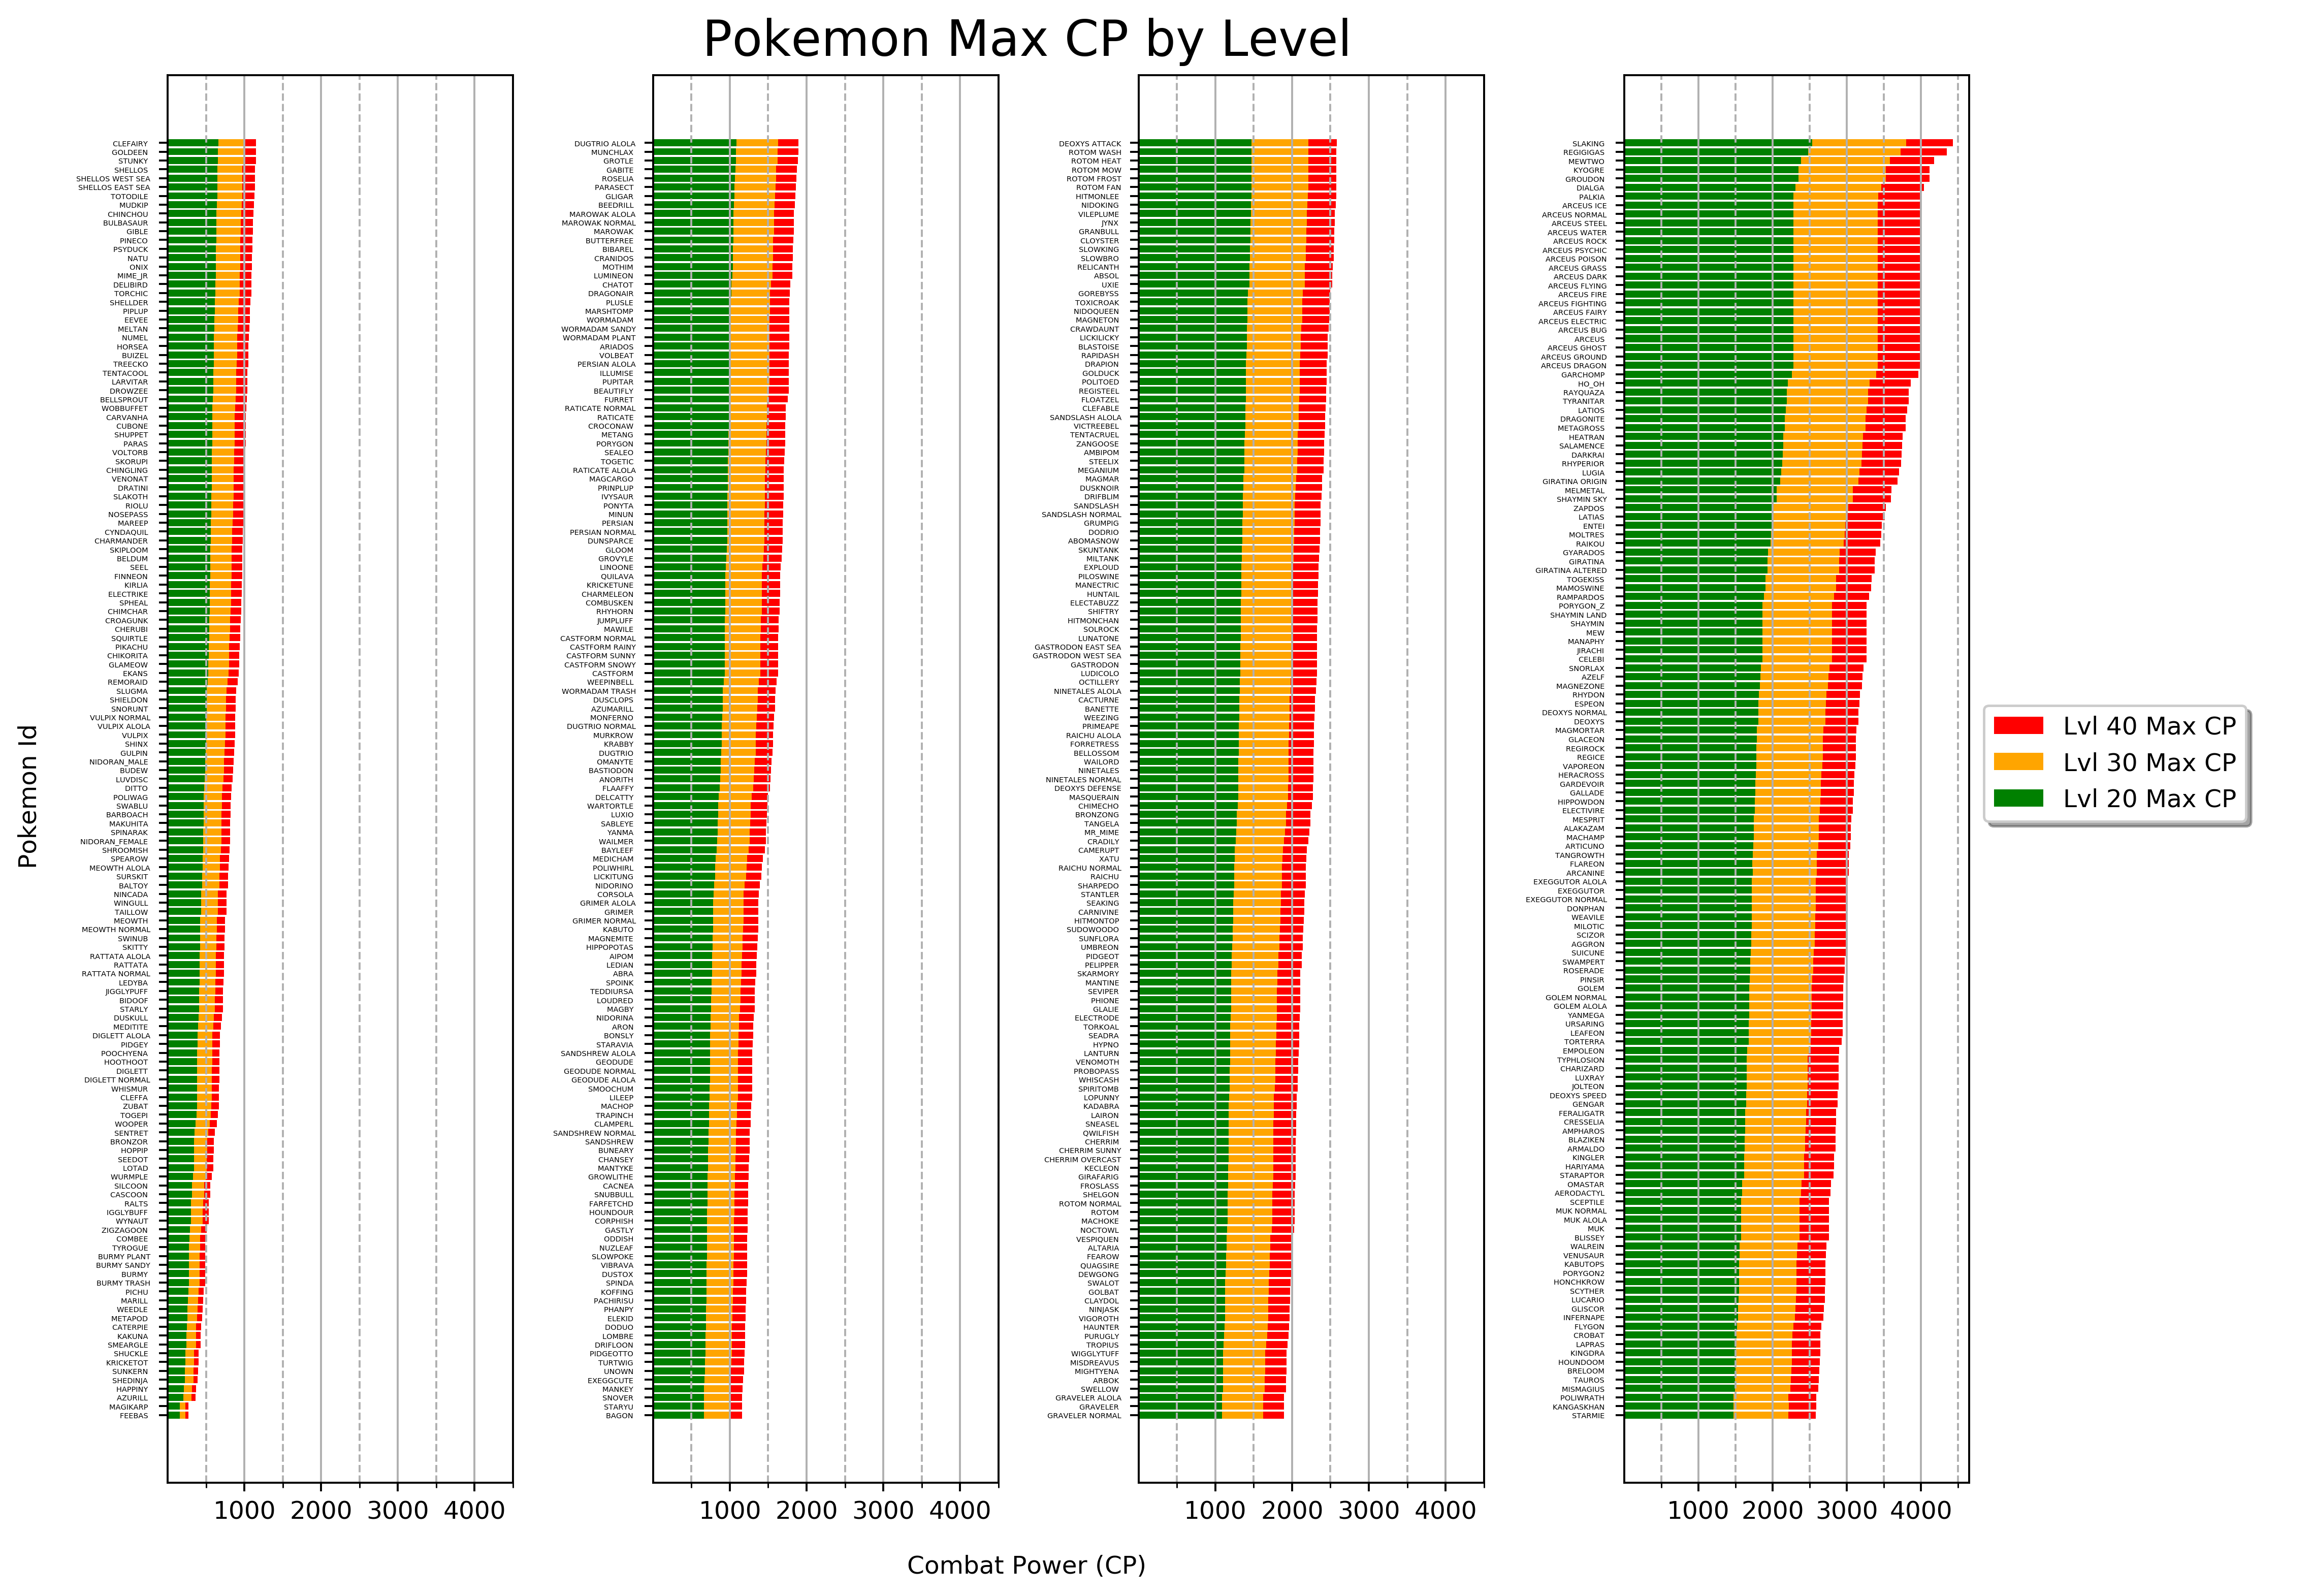
Attempt 9 – Four Horizontal Bar Chart Subplots (sorted by CP) 
Attempt 8 was okay, but it is difficult to read the Pokemon names when they are on the X-Axis. Attempt 9 sorts Pokemon by CP and makes four horizontal barchart subplots so that we can fiew all in a reasonable amount of space. I think this final representation is the best.
import math

%matplotlib inline
#%matplotlib notebook


plt.clf() # clear plot
#plt.cla() # clear axis

# Create figure to add subplots to
fig, ax = plt.subplots(ncols=4, sharey=False)
fig.set_size_inches(11, 8.5)

# Sort by highest cp first
df = df.sort_values(['cp_level_40', 'Name'])
df = df.reset_index(drop=True) # Set index to this newly sorted order

for i in range(0,4): # make 4 subplots, increasing in CP on each

    # Divide data into 4 equal slices
    start = int(math.ceil(0 + (df.shape[0]/4) * i))
    stop = int(math.ceil((df.shape[0]/4) + (df.shape[0]/4) * i))
    gen = df[start:stop]

    # Layer bars on top of eachother as before
    ax[i].barh(gen.index.values, gen['cp_level_40'], label='Lvl 40 Max CP', color='red')
    ax[i].barh(gen.index.values, gen['cp_level_30'], label='Lvl 30 Max CP', color='orange')
    ax[i].barh(gen.index.values, gen['cp_level_20'], label='Lvl 20 Max CP', color='green')

    # Define y-axis
    ax[i].set_yticks(gen.index.values)
    ax[i].set_yticklabels(gen['Name'] + ' ' + gen['Form'], fontsize=3)
    ax[i].tick_params(axis='y', which='minor', bottom=False)

    # Define x-axis
    ax[i].set_xticks([1000,2000,3000,4000])
    ax[i].grid(axis='x')

    ax[i].set_xticks([500,1500,2500,3500,4500], minor=True)
    ax[i].grid(axis='x', which='minor', linestyle='--')


# Set Legend above first axes
#ax[0].legend(loc='upper center', bbox_to_anchor=(0., 1.1, 1., .102),fancybox=True, shadow=True, ncol=4)
handles, labels = ax[0].get_legend_handles_labels()
fig.legend(handles, labels, bbox_to_anchor=(0., 0.5, 1.155, .102), loc='center right', fancybox=True, shadow=True)

# Set X and Y labels on figure
#fig.suptitle('Pokemon Max CP by Level', y = 1.01, fontsize=18)
fig.suptitle('Pokemon Max CP by Level', y=1.015, fontsize=20)
fig.text(-.01, 0.5, 'Pokemon Id', ha='center', va='center', rotation='vertical')
fig.text(0.5, -0.01, 'Combat Power (CP)', ha='center', va='center')

fig.tight_layout() # Stop x-axis tick labels from being cropped

# Export Figure as high resolution
fig.savefig('Pokemon_Max_CP_Attempt_9'+'.png', format='png', dpi=350, bbox_inches='tight') # tight required to prevent cropping

print("Done plotting")
Done plotting
<Figure size 432x288 with 0 Axes>
